老师例题取100度多项式回顾,手动预测的结果和pipeline的不一样?
来源:8-3 过拟合与欠拟合

junhuawa
2024-04-27
老师课上讲的题,我用手动的方式做多项式回归扩展X矩阵到100°,然后用Linear Regression来求出预测值并画出曲线,然后用pipeline的方式求出预测值并画出曲线,发现两条曲线不一样,这是什么原因啊?百思不得其解,有人能帮我回答一下吗?谢谢
import numpy as np
import matplotlib.pyplot as plt
from sklearn.linear_model import LinearRegression
from sklearn.preprocessing import PolynomialFeatures
np.random.seed(666)
x = np.random.uniform(-3, 3, size=100)
X = x.reshape(-1, 1)
y = 0.5*x**2 + x + 2 + np.random.normal(0, 1, size=100)


poly100_reg = PolynomialFeatures(degree=100)
poly100_reg.fit(X)
X_100 = poly100_reg.transform(X)

lin100_reg = LinearRegression()
lin100_reg.fit(X_100, y)
y100_predict = lin100_reg.predict(X_100)
plt.scatter(x, y)
plt.plot(np.array(np.sort(x)), y100_predict[np.argsort(x)], color='b')
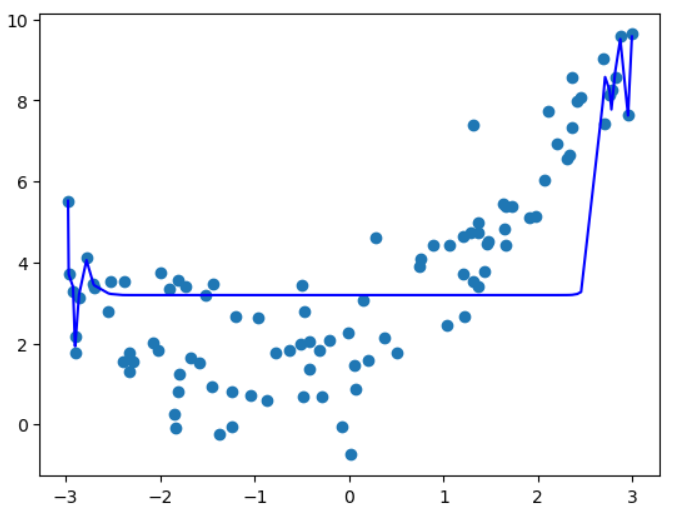
如果用pipeline得到的是和老师结果一样的曲线, 好奇怪!!!
from sklearn.pipeline import Pipeline
from sklearn.preprocessing import PolynomialFeatures
from sklearn.preprocessing import StandardScaler
def PolynomialRegression(degree):
return Pipeline([
("poly", PolynomialFeatures(degree = degree)),
("std_scaler", StandardScaler()),
("lin_reg", LinearRegression())
])
poly_reg100 = PolynomialRegression(100)
poly_reg100.fit(X, y)
y_predict100 = poly_reg100.predict(X)
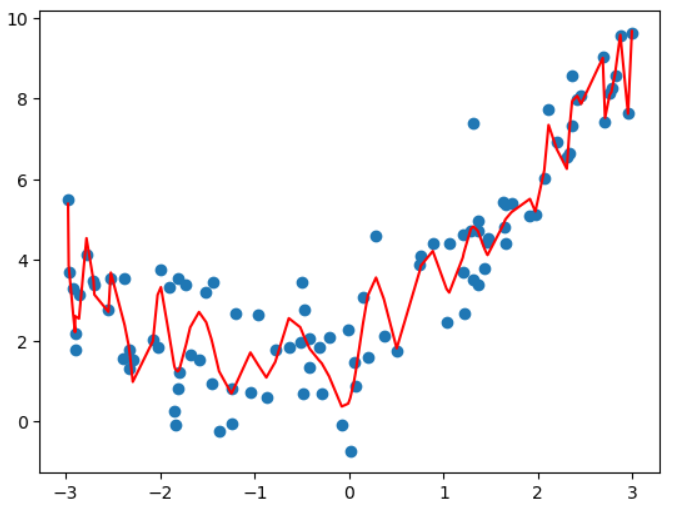
plt.scatter(x, y)
#plt.plot(np.array(np.sort(x)), y_predict2[np.argsort(x)], color='b')
plt.plot(np.array(np.sort(x)), y_predict100[np.argsort(x)], color='r')
写回答
1回答
-

liuyubobobo
2024-05-12
你的手动方式和 pipeline 不等价,中间差一个标准化的过程。
对于多项式回归来说,标准化是非常非常重要的。尤其是这个多项式回归使用 100 度这么高的级别,随便一个数值做一次 100 次方的运算,都大到天际去了。如果不做标准化,整个函数将被极端值左右。
以下是我针对你的代码的改动。注意我在中间添加了标准化过程,且在后续的步骤中使用了标准化后的数据。
import numpy as np
import matplotlib.pyplot as plt
from sklearn.linear_model import LinearRegression
from sklearn.preprocessing import PolynomialFeatures

np.random.seed(666)
x = np.random.uniform(-3, 3, size=100)
X = x.reshape(-1, 1)
y = 0.5*x**2 + x + 2 + np.random.normal(0, 1, size=100)

poly100_reg = PolynomialFeatures(degree=100)
poly100_reg.fit(X)
X_100 = poly100_reg.transform(X)

# 注意:在这里添加了标准化的过程
from sklearn.preprocessing import StandardScaler
standardScaler = StandardScaler()
standardScaler.fit(X_100, y)
X_100_standard = standardScaler.transform(X_100)

# 后续数据使用的是 X_100_standard,而非 X_100
lin100_reg = LinearRegression()
lin100_reg.fit(X_100_standard, y)
y100_predict = lin100_reg.predict(X_100_standard)

plt.scatter(x, y)
plt.plot(np.array(np.sort(x)), y100_predict[np.argsort(x)], color='b')
继续加油!:)
10

相似问题