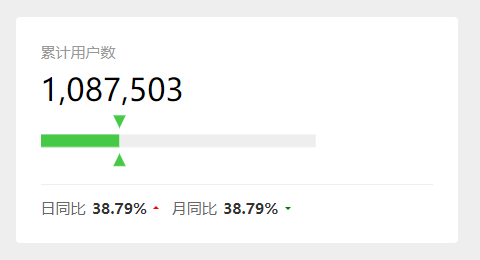
提问:为啥我的代码和老师写的都一样,但是效果展示不一样呢,右边有好多空白,我加了boundaryGap:false也没有效果
来源:6-2 vue-echarts组件库入门

一身喧哗
2024-02-28
<template>
    <div>
        <common-card
            title="累计用户数"
            value="1,087,503"
        >
          <template>
            <div id="total-users-chart" :style="{width: '100%', height: '100%'}" />
          </template>
          <template slot="footer">
              <div class="total-user-footer">
                <span>日同比</span>
                <span class="emphasis"> 38.79%</span>
                <div class="increase"></div>
                <span class="month">月同比</span>
                <span class="emphasis"> 38.79%</span>
                <div class="decrease"></div>
              </div>
          </template>
        </common-card>
    </div>
</template>

<script>
/* eslint-disable */
import commonCardMixin from '@/mixins/commonCardMixin';
    export default {
        mixins: [commonCardMixin],
        mounted() {
          const chartDom = document.getElementById('total-users-chart')
          const chart = this.$echarts.init(chartDom);
          chart.setOption({
            grid: {
              right: 0,
              left: 0,
              top: 0,
              bottom: 0
            },
            xAxis: {
              type: 'value',
              show: false,
              boundaryGap: false
            },
            yAxis: {
              type: 'category',
              show: false
            },
            series: [
              {
                data: [100],
                type: 'bar',
                barWidth: 10,
                stack: 'sum',
                itemStyle: {
                  color: '#45c946'
                }
              },
              {
                type: 'bar',
                data: [250],
                stack: 'sum',
                itemStyle: {
                  color: '#eee'
                }
              },
              {
                type: 'custom',
                data: [100],
                stack: 'sum',
                renderItem: (params, api) => {
                  const value = api.value(0)
                  const endPoint = api.coord([value, 0])
                  console.log(endPoint)
                  return {
                    type: 'group',
                    children: [{
                      type: 'path',
                      shape: { // 形状
                        d: 'M1024 255.995 511.971 767.909 0 255.996 1024 255.996z', // svg图像内容
                        x: -5, // 偏移量
                        y: -20,
                        width: 10, // 宽高
                        height: 10,
                        layout: 'cover'
                      },
                      style: {
                        fill: '#45c946'
                      }
                    }, {
                      type: 'path',
                      shape: { // 形状
                        d: 'M0 767.909l512.029-511.913L1024 767.909 0 767.909z', // svg图像内容
                        x: -5, //
                        y: 10,
                        width: 10, // 宽高
                        height: 10,
                        layout: 'cover'
                      },
                      style: {
                        fill: '#45c946'
                      }
                    }],
                    position: endPoint,

                  }
                }
              }
            ]
          })
        }
    }
</script>

<style lang="less" scoped>
.total-user-footer {
  display: flex;
  align-items: center;
  .month {
    margin-left: 10px;
  }
}
</style>
写回答
2回答
-

扬_灵
2024-03-06
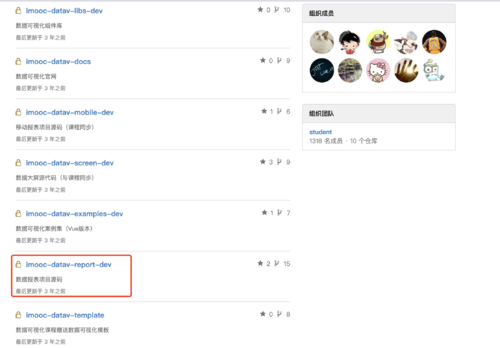
同学你好,课程代码在代码仓库中,在这章节中使用的是imooc-datav-report-dev 项目。我在项目中使用了你的代码是可以展开的,你试着降低echarts版本与课程一致试下。
 00
00 -
扬_灵
2024-02-29
同学你好,可以通过控制台先审查元素样式,如果不是样式的问题,可以吧完整的测试代码上传到giithub或是码云这些代码托管平台把地址发我一下,我在本地帮你测试定位一下问题。
042024-03-06

相似问题
百度地图自定义样式没有生效
回答 1
如何弱化绑定边的效果
回答 2
设置了CSS样式无效
回答 1
vscode 这个智能提示是怎么出现的?
回答 1
5.5节,容器初始化,只有部分组件显示
回答 2